


Productivity
The analysis, based on pooled data from two years, revealed that conventionally tilled plots (CT) produced higher maize grain yield (5152 kg ha-1) compared to reduced tillage (RT) (4705 kg ha-1), with no significant difference between them. This suggests that the improved soil microclimate under CT may have benefitted maize growth and establishment. Reduced tillage practices, with minimal soil disturbance, might not have sufficiently improved the soil’s physical properties to optimize plant growth and yield. The absence of weed control (weedy check) resulted in the lowest grain yield (2578 kg ha-1) and straw yield (5415 kg ha-1) due to intense weed competition throughout the critical growth period. However, yields improved with weed management measures. Hand weeding twice at 20 and 40 DAS achieved the highest grain yield (6625 kg ha-1), followed closely by herbicide application combined with hand weeding (Table 5). Notably, none of the herbicide treatments surpassed hand weeding twice.
Tillage practices significantly influenced safflower seed yield. Conventionally tilled plots (CT) consistently produced higher yields (1389 kg ha-1) compared to reduced tillage plots (1214 kg ha-1) (Table 6). This is likely due to improved soil structural conditions, such as higher porosity and infiltration, under conventional tillage, leading to better seed production. Similar to maize, weed management practices significantly increased safflower seed yield compared to the weedy check. Hand weeding twice at 20 and 40 DAS achieved the highest yield (1593 kg ha-1), followed closely by applying a pre-emergence herbicide combined with mulching using maize residue. These practices effectively controlled weeds, leading to a substantial increase in safflower seed yield. The lowest yield observed in the weedy check is attributed to severe competition from weeds for essential resources. Mulching further enhanced safflower yield by conserving soil moisture and suppressing weed growth.
Profitability
This study examined the economic and energy efficiency of various management practices within maize-safflower cropping systems. A key finding was that reduced tillage offered a cost-saving approach for maize cultivation. Compared to conventional tillage, which required more machinery, labour, and fuel, reduced tillage resulted in lower cultivation costs (27,946 ₹ ha-1) (Table 5). However, it’s important to note that conventional tillage led to higher maize grain yields. This ultimately resulted in no significant difference in net returns between the two tillage practices, highlighting the need to carefully weigh cost reductions against potential yield impacts. Effective weed management emerged as another critical factor influencing profitability. All weed management strategies, compared to the weedy check treatment, yielded higher net returns. This underscores the importance of suppressing weeds and ensuring crops have optimal access to resources like nutrients, moisture, light, and space. Among the weed management methods, hand weeding twice (W2) achieved the highest net returns (82,089 ₹ ha-1) for maize, likely due to its superior weed control effectiveness. However, this benefit came at a cost, as hand weeding also incurred the highest cultivation cost (34,632 ₹ ha-1) (Table 5).
Striking a balance between weed control effectiveness and cost is crucial. The study identified a promising option in pre-emergence herbicide application followed by a post-emergence application (W5). This approach achieved a high benefit–cost ratio (3.57) despite incurring a moderate cultivation cost (30,817 ₹ ha-1) (Table 5). This suggests that W5 offers a good balance between weed suppression and economic efficiency. The economic analysis for safflower revealed a preference for conventional tillage. Compared to reduced tillage, conventional tillage practices led to significantly greater gross returns, net returns, and benefit–cost ratios. This difference can be attributed to the higher safflower seed yields achieved with conventional tillage. This study provides valuable insights for optimizing economic and energy efficiency in maize-safflower cropping systems.
Total energy (MJ ha-1) for different inputs in maize
This study investigated the energy consumption patterns associated with various management practices in maize production. Based on pooled data from two consecutive years, the analysis revealed significant variability in energy use influence by tillage methods and weed management strategies.
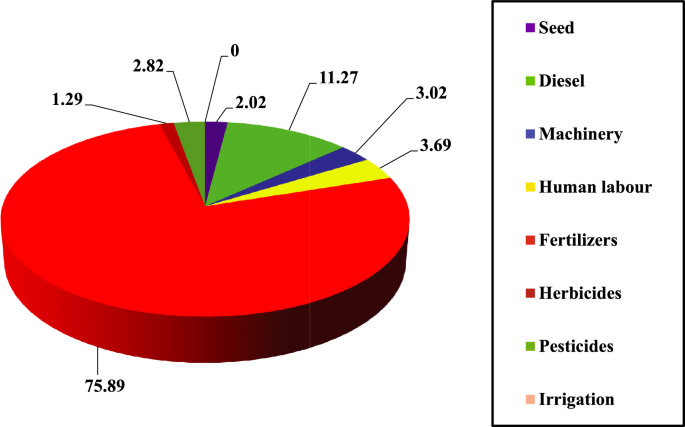
Among all input categories, chemical fertilizers were identified as the most energy-intensive components, contributing an average of 12,616 MJ ha-1, or approximately 75.89% of the total energy consumption across treatments (Fig. 1). Within this category, nitrogen fertilizers likely dominated the energy demand, followed by phosphorus and potash. Optimizing nitrogen application practices and exploring alternative nutrient sources are crucial for reducing the energy footprint of maize production. The study compared the energy consumption of conventional tillage (T1) and reduced tillage (T2) practices. Conventional tillage resulted in a considerably higher total energy input (17,302 MJ ha-1) compared to reduced tillage (15,942 MJ ha-1) (Table 7). This 7.86% difference can be attributed to the increased energy expenditure on diesel, machinery, and human labour associated with the additional tillage operations in conventional tillage. Diesel consumption in conventional tillage was nearly double that of reduced tillage (2,491 MJ ha-1 vs. 1,255 MJ ha-1), reflecting the substantial energy required for multiple passes with tillage implements. Machinery usage also followed a similar trend, with conventional tillage incurring higher energy consumption for machinery operation compared to reduced tillage.


Percentage share of various components in total energy input in maize production.
The study examined various weed management practices and their impact on energy consumption. The weedy check treatment (W1), where weeds were allowed to grow freely throughout the season, had the lowest total energy input (16,057 MJ ha-1) as it did not involve any weed management measures (Table 7). However, it is important to remember that this approach likely resulted in lower crop yields and overall energy output due to uncontrolled weed competition. Hand weeding twice (W2) achieved the highest total energy input (16,986 MJ ha-1) due to the significant human labour requirement associated with this intensive weed management method (Table 7). However, it also likely resulted in the highest energy output due to superior weed suppression and potentially higher crop yields. This highlights the trade-off between achieving effective weed control and the associated energy cost. Treatments involving a combination of pre-emergence herbicide application followed by a post-emergence application or hand weeding (W4, W5) presented a promising approach. These practicess offered a balance between effective weed control and energy efficiency. They displayed moderate energy input levels while achieving good weed suppression, suggesting a more sustainable approach to weed management in maize cultivation.
Percentage of total energy for different inputs in maize
The research compared the energy consumption profiles of conventional tillage (T1) and reduced tillage (T2) practices. Conventional tillage resulted in a considerably higher total energy input (17,302 MJ ha-1) compared to reduced tillage (15,942 MJ ha-1). This 7.86% difference can be attributed to the increased energy expenditure on diesel, machinery, and human labour associated with the additional tillage operations employed in conventional tillage. Diesel consumption in T1 was nearly double that of T2 (14.40% vs. 7.87%), reflecting the substantial energy required for multiple passes with tillage implements. Machinery usage also followed a similar trend, with T1 incurring higher energy consumption for machinery operation compared to T2 (3.24% vs. 2.78%). Chemical fertilizers emerged as the most energy-intensive input category, accounting for an average of 75.89% of the total energy consumption across all treatments (Fig. 1). This translates to a staggering 12,616 MJ ha-1, highlighting the significant energy footprint associated with fertilizer use in maize cultivation (Fig. 2). Within this category, nitrogen fertilizers are likely the primary contributor, followed by phosphorus and potash. Optimizing nitrogen application practices and exploring alternative nutrient sources present crucial opportunities for reducing the energy demands of maize production.


Input-wise energy consumption for maize (MJ ha-1).
The experiment examined various weed management strategies and their impact on energy consumption. The weedy check treatment (W1), where weeds were allowed to grow freely throughout the season, had the lowest total energy input (16,057 MJ ha-1) as it did not involve any weed control measures. However, it is crucial to consider that this approach likely resulted in lower crop yields and overall energy output due to uncontrolled weed competition, negating the potential benefits of lower energy input. Hand weeding twice (W2) achieved the highest total energy input (16,986 MJ ha-1) due to the significant human labour requirement associated with this intensive weed control method. This translates to 5.72% of the total energy consumption. However, it also likely resulted in the highest energy output due to superior weed suppression and potentially higher crop yields. This finding highlights the trade-off between achieving effective weed control and the associated energy cost. Treatments involving a combination of pre-emergence herbicide application followed by a post-emergence application or hand weeding (W4, W5) presented a promising approach. These strategies offered a balance between effective weed control and energy efficiency. They displayed moderate energy input levels (ranging from 3.47% to 3.51% for machinery) while achieving good weed suppression, suggesting a more sustainable approach to weed management in maize cultivation.
Total energy (MJ ha-1) for different inputs in safflower
This study also investigated the energy consumption patterns associated with various tillage practices and weed management strategies in maize production. The analysis, based on the data presented in the table 8, reveals significant differences in energy use across different treatment combinations. Consistent with previous findings, chemical fertilizers remained the most energy-intensive input category across all treatments. The average energy consumption for fertilizers was 33,280 MJ ha-1, representing approximately 66.33% of the total energy input (Fig. 3). This emphasizes the critical role of optimizing nitrogen application practices and exploring alternative nutrient sources for reducing the energy footprint of maize production. The study compared the energy consumption of four tillage practices (T1, T2, T3, and T4). While the specific details of each tillage method are not provided, the data suggests a trend towards higher energy use with conventional tillage practices. The mean energy consumption for all tillage practices was 15,730 MJ ha-1 (Table 8). However, it is important to note that some variations existed within the tillage category. For instance, T1 and T3 appear to be more energy-intensive compared to T2 and T4, likely due to differences in the number or intensity of tillage operations employed in these treatments. Diesel consumption followed a similar pattern, with an average of 1,573 MJ ha-1 across all tillage practices. However, T1 and T3 likely involved higher diesel consumption compared to T2 and T4 due to the additional energy required for multiple tillage passes.


Input-wise energy consumption for safflower (MJ ha-1).
The study examined the impact of seven weed management strategies (W1 to W7) on energy consumption. The weedy check treatment (W1), where weeds were allowed to grow freely throughout the season, had the lowest total energy input (14,898 MJ ha-1) as it did not involve any weed control measures (Table 8). However, neglecting weed control likely resulted in lower crop yields and overall energy output due to uncontrolled weed competition. Hand weeding twice (W2) achieved a total energy input of 15,444 MJ ha-1, which was higher than the weedy check treatment but lower than some herbicide-based strategies (Table 8). While hand weeding offers effective weed control, it requires significant human labour, leading to increased energy consumption.
Treatments involving pre-emergence herbicide application (W4 and W5) emerged as promising options for balancing weed suppression with energy efficiency. These strategies displayed moderate energy input levels (15,522 MJ ha-1 and 16,221 MJ ha-1, respectively) while achieving good weed control through herbicide application. The inclusion of mulching (W6) significantly increased the total energy input to 80,773 MJ ha-1. The data suggests that the additional energy associated with acquiring and applying mulch outweighed the potential benefits in terms of weed suppression and moisture conservation. The highest energy consumption observed in the study was associated with W7 (83,020 MJ ha-1). This treatment involved a combination of mulching and a very high herbicide application rate (62,500 MJ ha-1). While this approach might achieve complete weed control, the excessive use of herbicides significantly increases the energy footprint of safflower production and raises potential environmental concerns.
Percentage of total energy for different inputs in safflower
The analysis, based on pooled data from two years, revealed significant differences in energy use depending on tillage practices and weed management practices. Values presented in the Fig. 4represent percentages of total energy consumption. Chemical fertilizers emerged as the most energy-intensive input category, accounting for an average of 12.99% of the total energy consumption across all treatments. Within the fertilizer category, nitrogen fertilizers were likely the primary contributor, followed by phosphorus and potash. The data (mean values for sub plots) indicates that fertilizers consistently constituted around 13% of the total energy demand, highlighting the importance of optimizing nitrogen application practices and exploring alternative nutrient sources for a more sustainable approach to safflower production (Fig. 4).


Percentage share of various components in total energy input in safflower production.
The study compared the energy consumption of conventional tillage and reduced tillage practices. Conventional tillage practices resulted in a higher total energy input compared to reduced tillage. Diesel consumption in conventional tillage was nearly double that of reduced tillage (around 7.3% vs. 5% of total energy), reflecting the substantial energy required for multiple passes with tillage implements. Machinery usage also followed a similar trend, with conventional tillage incurring higher energy consumption for machinery operation compared to reduced tillage (around 0.8% vs 0.79% of total energy). These findings suggest that reduced tillage offers a significant opportunity to reduce energy use in maize cultivation.
The study examined various weed management strategies and their impact on energy consumption. The weedy check treatment (W1), where weeds were allowed to grow freely throughout the season, had the lowest overall energy input (around 15.2% of total energy for irrigation and 21.3% for diesel). However, it is important to remember that this approach likely resulted in lower crop yields and overall energy output due to uncontrolled weed competition.
Hand weeding twice (W2) achieved the highest total energy input (around 12% for human labour and 20.3% for diesel) due to the significant human labour requirement associated with this intensive weed control method. However, it also likely resulted in the highest energy output due to superior weed suppression and potentially higher crop yields. This highlights the trade-off between achieving effective weed control and the associated energy cost.
Treatments involving a combination of pre-emergence herbicide application followed by a post-emergence application or hand weeding (W4, W5) presented a promising approach. These strategies displayed moderate energy input levels (around 5.7–10.5% for herbicides) while achieving good weed suppression, suggesting a more sustainable approach to weed management in maize cultivation. Notably, a treatment with a high mulching application (W6) resulted in a drastically different energy consumption profile, with mulching constituting a significant portion (around 89%) of the total energy input (Fig. 4). However, the data for W6 appears to be an outlier and requires further investigation.
Energetics
Maize energetics
Conventional tillage (T1) resulted in a higher total energy input (17,302 MJ ha-1) compared to reduced tillage (T2) (15,943 MJ ha-1). This translates to a 7.86% difference, primarily due to the increased energy expenditure on diesel, machinery, and human labour associated with the additional tillage passes in conventional tillage.
The strategy employed for weed control significantly influenced energy consumption and output. The weedy check treatment (W1), where weeds were allowed to grow freely, had the lowest total energy input (16,059 MJ ha-1) but also the lowest gross energy output (104,194 MJ ha-1) due to uncontrolled weed competition. Hand weeding twice (W2) achieved the highest total energy input (16,820 MJ ha-1) but also the highest gross energy output (200,146 MJ ha-1) likely due to superior weed suppression and potentially higher crop yields (Table 7). This highlights the trade-off between achieving effective weed control and the associated energy cost. Treatments involving a combination of pre-emergence and post-emergence herbicide applications or hand weeding offered a promising balance. These strategies displayed moderate energy input levels while achieving good weed suppression.
Across all treatments, energy use efficiency for maize production remained relatively constant, ranging from 6.49% (weedy check) to 11.90% (hand weeding twice). This indicates the amount of energy used to produce a unit of grain yield. Similarly, energy productivity, measured as the grain yield per unit of total energy input, showed minimal variation across treatments (0.49 kg MJ-1 to 0.88 kg MJ-1). However, energy intensity, which reflects the energy required to produce a unit of grain yield, displayed differences. Conventional tillage (T1) and the weedy check treatment (W1) exhibited higher energy intensity values (1.48 MJ kg-1 and 2.05 MJ kg-1, respectively), suggesting a less efficient conversion of energy into crop yield. In contrast, hand weeding twice (W2) resulted in the lowest energy intensity (1.14 MJ kg-1), indicating a more efficient utilization of energy for grain production.
Economic considerations
There was a trend of lower energy intensity in economic terms (energy used per unit of money spent) with conventional tillage (5.48 MJ ₹-1) compared to reduced tillage (5.70 MJ ₹-1) (Table 7). However, it is important to consider the trade-off between energy use and economic viability. Conventional tillage may have a higher upfront cost due to increased labour and fuel requirements, which could negate the benefit of a slightly lower energy intensity in economic terms.
Safflower energetics
The analysis of safflower production revealed some key differences compared to maize. Unlike maize, there were no statistically significant differences in total energy input observed between the different tillage practices for safflower. Similar to maize, weed control strategies significantly impacted safflower. The weedy check treatment (W1) again had the lowest energy input (7,384 MJ ha-1) but also the lowest gross energy output (70,812 MJ ha-1). The gross energy output was higher with hand weeding twice at 20 and 40 DAS (115692 MJ ha⁻¹) which was on par with the application of Pendimethalin @ 1.0 kg a.i. ha⁻¹ (PE) fb mulching with maize residues @ 5 t ha⁻¹ (112421 MJ ha⁻¹) because of higher biological yield obtained in these treatments (Table 7).
Energy use efficiency and energy productivity for safflower production displayed a wider range compared to maize. The weedy check treatment had the lowest values (9.59% and 0.46 kg MJ-1, respectively), while hand weeding twice at 20 and 40 DAS (W2) achieved the highest values (14.89% and 0.71 kg MJ-1, respectively). Energy intensity values in safflower were generally higher than those observed in maize, ranging from 1.42 MJ kg-1 (weedy check) to 5.61 MJ kg-1 (conventional tillage with pre-emergence herbicide) (Table 7). Similar to maize, safflower displayed a trend of lower energy intensity in economic terms with conventional tillage practices compared to reduced tillage.
link