


Study site
The research site was located within the Mártély Landscape Protection Area of Kiskunság National Park in Hungary (Fig. 1), on the left bank of the Tisza River within its floodplain. The area has been under protection since 1971 and part of the Ramsar Convention since 1979. It encompasses the Körtvélyes and Mártély (Ányási) oxbow lakes, formed by the truncation of two Tisza meanders (Fig. 1a) [27].

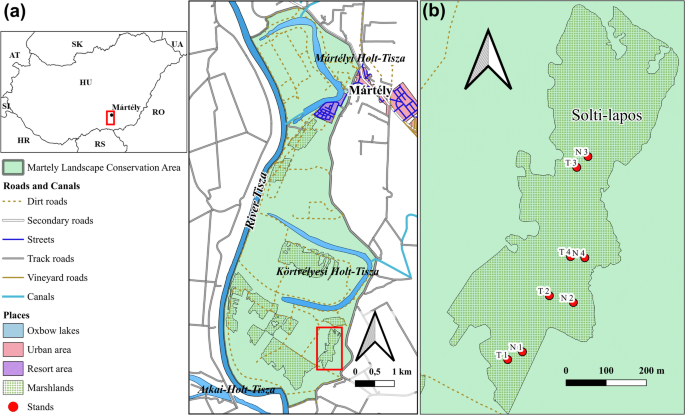
Location and layout of the study area. (a) The Mártély Landscape Protection Area, highlighting the Solti-lapos marshland. (b) Four pairs of selected stands in the Solti-lapos marshland: N: non-invaded, combined managed stands (1–4), T: Amorpha fruticosa–invaded, combined-managed stands
The study area includes floodplain marsh meadows and oxbow lake habitats. Marsh vegetation is dominated by typical wet-meadow species, including Agrostis stolonifera L., Phalaris arundinacea L., and Alopecurus pratensis L. The broader landscape contains floodplain forests and plantations dominated by willow and poplar species, which were not part of the study [28,29,30]. The flora of the oxbow lakes is characterized by species such as Trapa natans L., Salvinia natans (L.) All., Hydrocharis morsus-ranae L., and various Potamogeton species [28].
A multiscale study of A. fruticosa invasion was conducted in the Solti-lapos marsh meadow (Fig. 1b). This 27.92-ha area was used for both pasture and arable farming until the political transition in 1989. After the transition, conservation-focused management, particularly targeting invasive species was initiated. In 2002, the National Park Directorate launched restoration efforts under the KEOP project, targeting A. fruticosa-invaded sites, including Solti-lapos. By the late 2000 s, the land was leased to tenants, and from 2014 onward, lease agreements required the removal of alien woody species (e.g., shrubs and trees) from overgrown former grassland for grassland restoration. At Solti-lapos, management combined grazing and mowing. On average, 25–30 Hungarian Grey Cattle graze the site annually (0.90–1.07 animals/ha), rotating among up to three subareas. Grazing was not continous throughout the grazing season; higher-quality sections were grazed after mowing, whereas lower-quality areas were mown postgrazing for cleanup [31].
Clearance of heavily wooded or A. fruticosa-dominated areas occurred in small sections annually or gradually. Annual flooding patterns also influenced the planning and execution of these efforts. The National Park has implemented a conservation strategy that involving the preservation of sedge- and tussock-dominated areas during winter as refuges for overwintering birds, managing in spring, provided they are not inundated [31]. The study area primarily consisted of sensitive permanent grasslands, mainly marsh meadows, classified under the MePAR system [30] (Fig. 1b). This grassland ecosystem was the focus of the study.
Field sampling
This investigation was conducted in July 2023, during the vegetation period, after the main mowing phase and before postmowing grazing began in most areas. Four vegetation stands were designated as “non-invaded” (N), referring to native marshland unaffected by A. fruticosa, and four as “treated” (T), referring to formerly invaded stands where A. fruticosa remained present during sampling. In T stands, A. fruticosa occurred in 16.7–19.8% of microquadrats, a high frequency given its size and structure. All stands underwent the same mowing and grazing regime; thus, the N-T distinction reflects invasion status only, not treatment history. Stands were paired (N-T), to ensure similar environmental conditions and site histories [32].
Stands were selected randomly while deliberately excluding areas with major disturbance, such as pathways, fallen trees, and animal burrows. A 26-m-long belt transect was established in each stand for sampling. Each transect followed a circular layout, beginning and ending at the same point [23, 33]. Transects comprised 520 sampling subunits, designated as microquadrats, measuring 5 × 5 cm [11, 34]. The 26-m length ensured inclusion of 520 microquadrats, an optimal sample size for information-theoretic structural analysis based on the JNP model [24, 26, 34, 35]. This length also aligned with the average size of homogeneous vegetation patches in the area, enabling high-resolution structural analysis with minimal edge effects. Transects were strategically positioned within the stands to ensure uniform vegetation coverage [26]. Species presence was recorded in each 5 × 5 cm microquadrats along the transects, using Király [36] as the reference for plant identification. Plant material was identified by Krisztina Napsugár Nagy and László Bakacsy. No plant samples were collected, as the sites’s protected status and the noninvasive methodology precluded material remloval.
Data analyses
The study employed a multiscale analytical framework based on the spatial series methodology developed by Juhász-Nagy [37] and Juhász-Nagy and Podani [24], hereinafter referred to as the JNP model. This approach calculates information-theoretical diversity metrics across hierarchical spatial scales. Specifically, 5 × 5 cm quadrats along 26-m circular transects were aggregated by doubling plot sizes, enabling assessment of diversity and structural complexity at increasing spatial extents [34]. This spatial scaling captures fine-scale beta diversity and community organization, enabling the identification of scales at which vegetation structure is most pronounced. This approach reveals the spatial embedding of species coexistence patterns and highlights scale-dependent effects of invasion [21]. These JNP models include several community-level functions; two were used in this study.
CD reflects the structural diversity of plant communities based on the Shannon diversity of species combinations at each spatial scale. This metric evaluates community complexity based on the frequency distribution of individual species and captures variability in coexistence patterns using information theory. CD values are expressed in binary digits (bits), with smaller quadrat sizes are particularly sensitive to microscale changes in coexistence. Higher CD values reflect greater heterogeneity in species composition and more complex coexistence patterns at the examined spatial scale [25, 26, 37, 38].
NRC quantifies the structural complexity and variability in species coexistence. It indicates how the spatial distribution and abundance of individual species contribute to community pattern formation. NRC is a dimensionless metric that increases exponentially with species richness, making it highly sensitive to such changes. Its maximum values are especially useful for assessing fine-scale beta diversity and estimating landscape-scale variation, particularly when interpreting complex spatial relationships [26, 38, 39]. NRC also enhances understanding of community structure and dynamics through spatial scaling and random reference analysis [21, 25].
High CD values indicate greater compositional diversity, i.e., more heterogeneous species combinations across spatial scales, whereas low values reflect more homogeneous community structure. Similarly, high NRC values suggest more complex coexistence patterns with numerous unique combinations, whereas low values indicate reduced structural variability. All indices were calculated at the transect level using the complete set of 520 microquadrats per stand, thereby reflecting aggregated spatial patterns across scales rather than quadrat-level diversity [21, 34, 38].
In addition to JNP function maxima, the characteristic area (CA) was considered, defined as the spatial scale (in cm²) at which a function reaches its peak [21, 23, 38]. The CA and the function maximum values provide insights into the internal structure and diversity of plant communities. When coexistence is not limited by biotic interactions or environmental filters, species tend to assembly, often producing peak function values at the smallest scales.
The use of CD and NRC functions in field studies to investigate vegetation pattern relationships has been further developed within the INFOTHEM program. JNP function calculation were performed usinf INFOTHEM 3.01 [26, 40], which enables precise scaling of structural diversity during analysis [26, 40, 41]. Species with an occurrence frequency below 2% (present fewer than 11 of 520 quadrats per transect) were excluded to reduce bias and avoid complications from stochastic rare species [22, 42].
To assess the contribution of invasive species to vegetation structure, we analyzed two datasets: one including (T + Am) and one excluding (T –Am) invasive A. fruticosa [43], treating it as equivalent to native species in the former and excluding it from the model in the latter. This approach tested the hypothesis that A. fruticosa introduces artificial structural complexity into the invaded community. By removing the dominant invasive species (T –Am), we aimed to determine whether observed diversity reflects genuine community structure or is an artifact of invasion. Although both datasets originate from the same plots, their comparison clarifies the structural contribution of A. fruticosa. This distinction helps differentiate communities that are intrinsically diverse from those where diversity is inflated by a single dominant species.
Random reference datasets were generated using complete randomization with 5,000 Monte Carlo-generated iterations [24, 26, 44]. This process involved randomly redistributing the occurrence data of all species along each transect [26, 33, 35]. In INFOTHEM, all JNP functions values were normalized at each spatial step based on the number of sampling unit, eliminating bias from sample size differences across scales [26, 40].
Statistical analyses
A paired t-test was used to compare the species frequency of occurrence values, and mixed-effects models were implemented evaluate JNP function values and their CA distribution across stands. Data normality was tested using the Shapiro–Wilks test. Where normality was confirmed, Tukey’s post hoc test was applied; for non-normal data, the, Friedman’s test was used. Statistical significance was set at p ≤ 0.05, and results are presented as means ± SD. All statistical analyses and plots were conducted using GraphPad Prism 8.0.1.244 (GraphPad Software, La Jolla, California, USA).
link